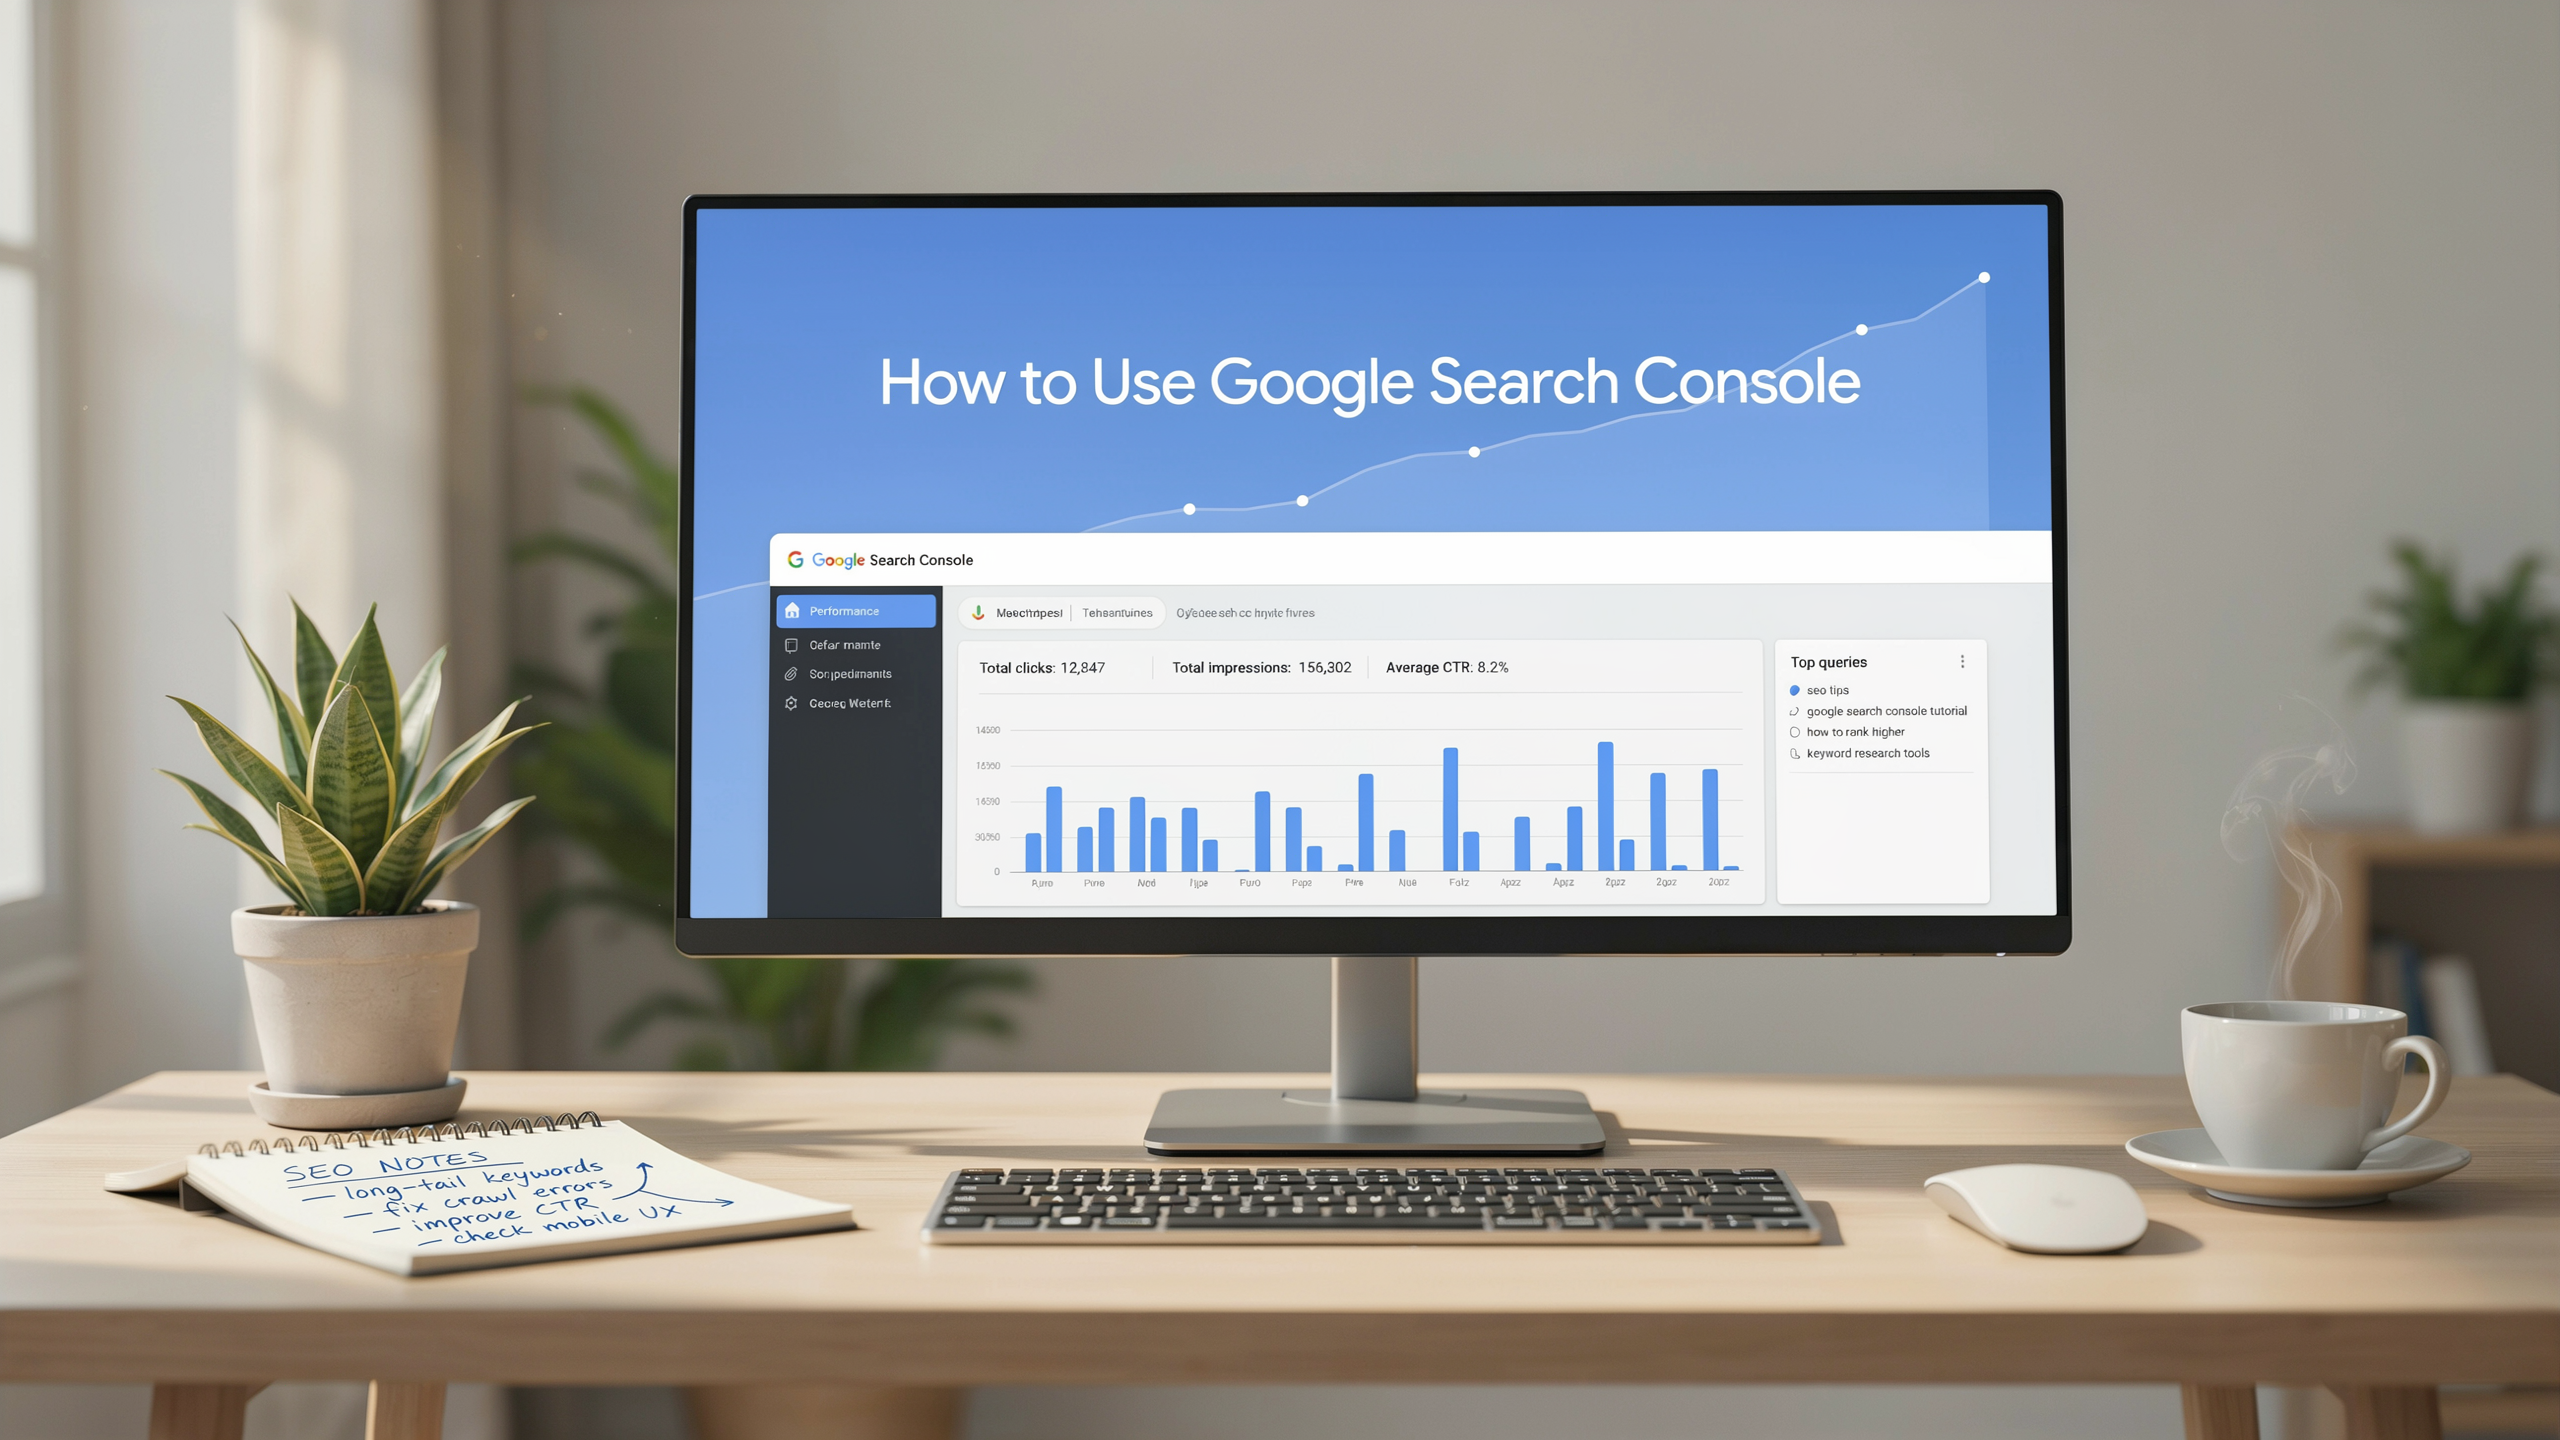
Google Search Console is a free tool from Google that shows exactly how your site performs in organic search. It tells you which queries bring traffic, how often your pages appear, and where technical problems might be holding you back. Knowing how to use Google Search Console gives you direct data no third-party tool can match. This guide walks through the core reports and how to turn them into real SEO improvements.
Key Takeaways
- Google Search Console is the most reliable source of search performance data because it comes directly from Google, showing you real queries, clicks, and average positions that no third-party tool can match.
- Mastering the Performance report unlocks keyword and page-level insights that help you prioritize content optimizations and identify quick wins for traffic growth.
- Index Coverage and URL Inspection tools are critical for technical SEO, allowing you to ensure all important pages are indexed and to diagnose crawling or rendering issues.
- Core Web Vitals and page experience signals are now integral to rankings, and GSC provides a clear report to help you meet Google's thresholds.
- Regular monitoring of security issues and manual actions protects your site's reputation and prevents sudden drops in organic visibility.
What Is Google Search Console?
Google Search Console is a free web service from Google that lets you monitor and maintain your site's presence in search results. It gives you a direct line to see how Google crawls, indexes, and serves your pages. Unlike third-party tools that estimate data, Search Console provides actual performance metrics straight from Google's own systems. Anyone serious about organic search needs it.
The platform shows you which queries bring users to your site, how often your pages appear, and which other websites link to yours. It also alerts you to issues that could hurt rankings: mobile usability problems, security threats, manual actions. Knowing how to use Google Search Console helps you spot opportunities to improve content, fix technical errors, and drive more qualified traffic. This guide covers every major feature and how to turn raw data into practical steps.
How to Set Up Google Search Console

Getting started with how to use Google Search Console means adding and verifying your website property. Log into your Google account, go to the Search Console dashboard, and click "Add property." You'll see two options: a Domain property or a URL prefix property. A Domain property covers all URLs across subdomains and protocols. A URL prefix property is scoped to a specific address pattern. For most site owners, the Domain property is the better choice. It gives you comprehensive data without separate verifications for http, https, www, and non-www versions.
After selecting your property type, you must prove ownership. For a Domain property, verification is done exclusively through a DNS record. Google provides a unique TXT record value that you add to your domain's DNS configuration via your registrar or hosting provider. This method is secure and doesn't interfere with your site's operation. Once the record is added, click "Verify." DNS propagation can take up to 72 hours, though it often completes within minutes.
For a URL prefix property, several verification methods are available. The most common is uploading an HTML verification file to your website's root directory. You can also add an HTML meta tag to your site's <head> section. If you have edit permissions, use your Google Analytics or Google Tag Manager account. Or verify via your domain name provider. Choose the method that fits your technical comfort level and access rights. After successful verification, you'll gain immediate access to performance data, index coverage, and the full suite of tools.
Navigating the Google Search Console Dashboard
After you verify site ownership, the Google Search Console dashboard becomes your central command for monitoring organic search health. The left-hand navigation groups tools into logical buckets. Understanding each one is the first step in learning how to use Google Search Console effectively. The Overview screen surfaces a snapshot of performance, coverage, and enhancements. You can spot anomalies at a glance without diving into reports.
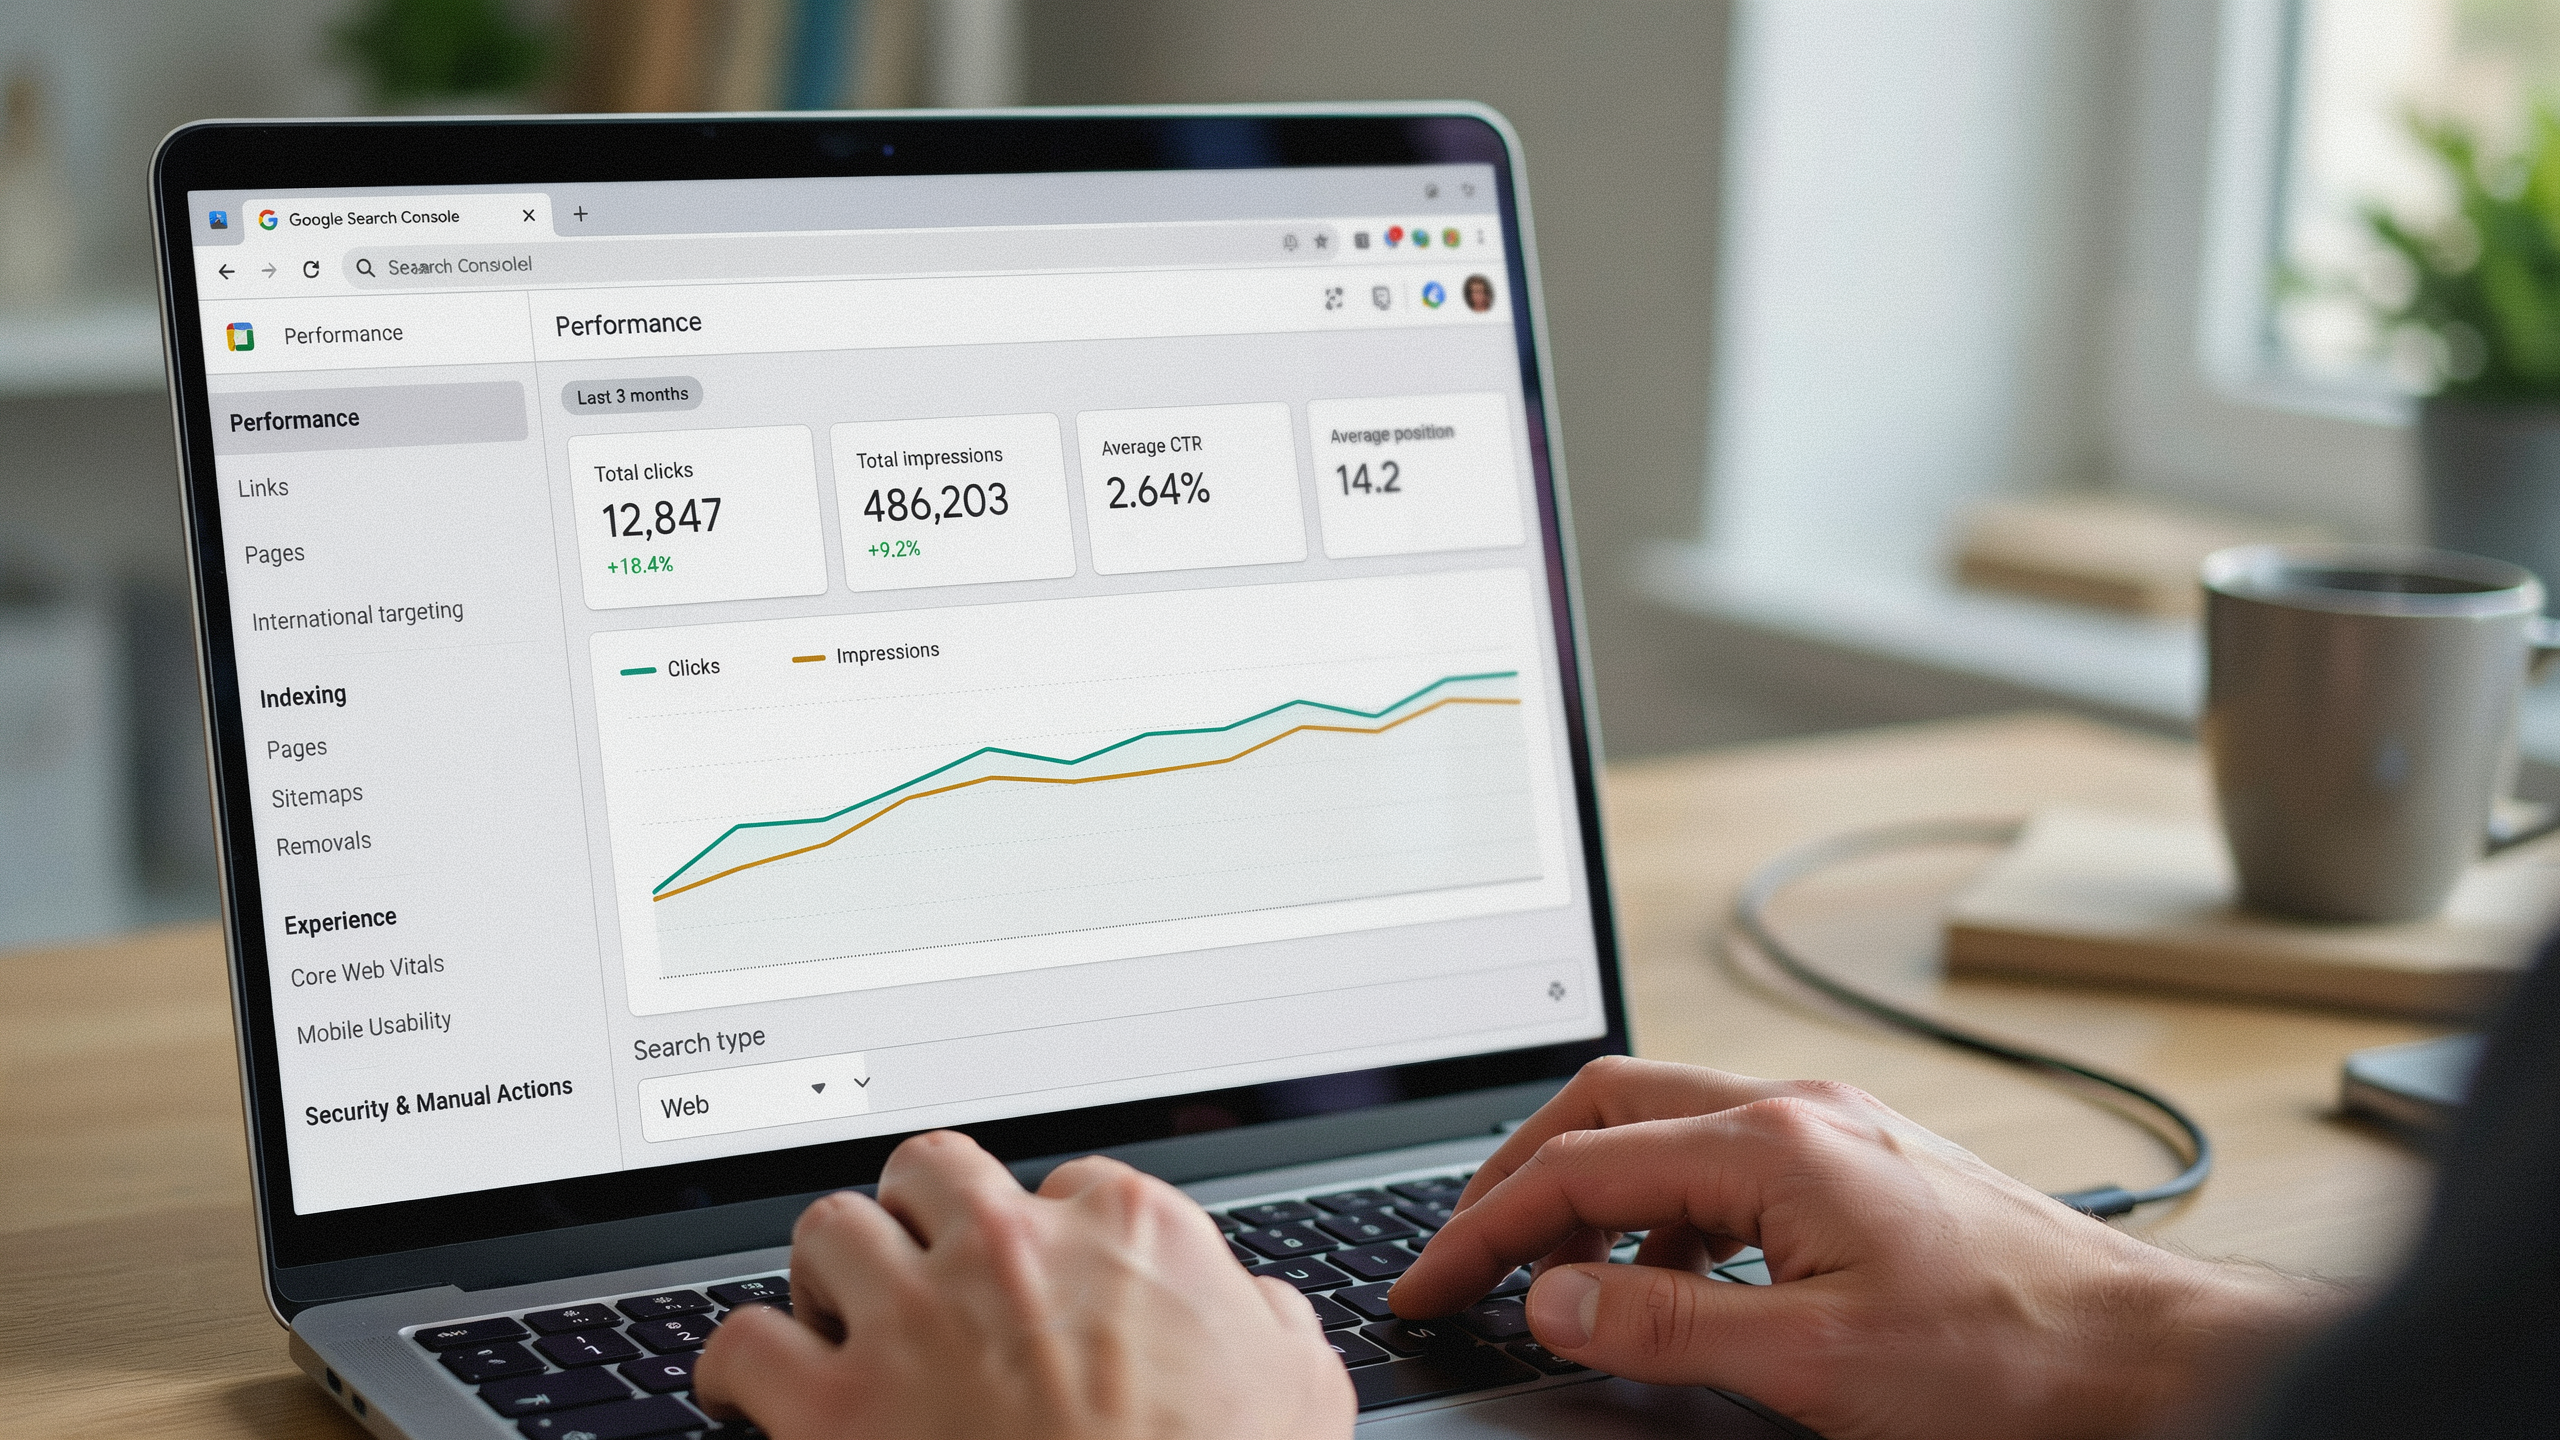
The Performance tab is where most SEO work happens. It shows total clicks, impressions, average click-through rate, and average position over your chosen date range. You can filter by query, page, country, device, and search appearance to isolate exactly what drives traffic. Beneath those metrics, the table breaks down individual queries and pages. You can identify which terms bring visitors and which pages rank but fail to earn clicks.
Next, the URL Inspection tool gives you a page-level diagnostic. Paste any URL on your property and you'll see its index status, any crawl or rendering issues, the canonical URL Google selected, and a live test option that fetches the page in real time. This is invaluable when you need to confirm a fix took effect without waiting for the next crawl cycle.
The Index section houses the Coverage report. It catalogs indexed, excluded, and error pages with specific reasons for each status. It also contains the Sitemaps area where you submit XML sitemaps and monitor their processing history. Finally, the Experience group includes Core Web Vitals and HTTPS reports. These connect technical page experience signals directly to your search visibility. Together, these sections form a complete feedback loop from crawl to click.
Understanding the Performance Report
The Performance report is the heart of Google Search Console. It shows exactly how your site appears in Google Search results. It tracks four core metrics: total clicks, total impressions, average CTR, and average position. Clicks count every time a user selects your link from the search results. Impressions record how often your pages were shown, even if they weren't clicked. Average CTR is the click-through rate calculated as clicks divided by impressions. Average position reflects your typical ranking for a given query or page. Together, these metrics reveal how visible your content is and how compelling your titles and descriptions are to searchers.
You can slice this data using filters that make the report actionable. The default view shows all queries, but you can filter by specific search terms to see which keywords drive traffic. For example, if you want to understand how to use Google Search Console to find your best-performing queries, simply click the "+ New" filter and select "Query." You can also filter by page to assess individual URL performance. Filter by country to see geographic trends. Or filter by device to compare desktop versus mobile behavior. These filters let you isolate exactly the segment you need to analyze. Whether you're auditing a blog post or checking if a recent update improved rankings, the data is there.
Beyond the default chart, the table below the graph lists queries, pages, countries, and devices with their corresponding metrics. You can sort by clicks to see your top traffic drivers. Sort by impressions to identify terms where you have high visibility but low clicks. That often signals a need for better meta descriptions. The date range selector lets you compare performance over time, such as the last 28 days versus the previous period. You can spot trends. For deeper analysis, use the "Search Appearance" tab to see how rich results like FAQs or reviews impact your metrics. This level of detail makes the Performance report a foundational tool for any SEO professional looking to refine their strategy based on real user behavior.
Using the Search Results Tab for Keyword Insights
One of the most valuable ways to learn how to use Google Search Console is by exploring the Search Results tab. It reveals the exact queries driving organic traffic to your site. This report sits inside the Performance section. It breaks down clicks, impressions, average click-through rate (CTR), and average position for every search term your pages rank for. By default, it shows the last three months of data. You can adjust the date range to spot seasonal trends or measure the impact of recent content updates. The table view lists queries in descending order of clicks. It's easy to see which keywords already deliver results. The chart above visualizes total clicks and impressions over time.
To uncover high-impression, low-CTR queries, add a filter for "CTR less than 2%" and sort by impressions. These are terms where your page appears often but rarely gets clicked. Often the title tag or meta description fails to match searcher intent. For example, a query with 5,000 monthly impressions and a 0.8% CTR represents a clear opportunity. Rewriting the snippet to include a stronger call to action or a more specific benefit can lift clicks without needing to improve rankings. Pair this with the average position metric. Prioritize queries ranking between positions 4 and 15. Small CTR gains there can produce meaningful traffic increases.
Spotting new keyword opportunities requires a slightly different lens. Switch the filter to show queries with zero clicks but high impressions. Then look for terms where your average position is below 20. These are keywords you rank for incidentally. Maybe through a related blog post or a product page that mentions the topic in passing. Creating dedicated content around these queries, or optimizing existing pages to better target them, can turn passive impressions into active traffic. Export the data to a spreadsheet and group queries by topic cluster. You'll see which subject areas deserve deeper coverage. The Search Results tab also lets you compare query performance across devices and countries. You can tailor content for mobile-first audiences or prioritize keywords trending in a specific region.
Analyzing Pages and Content Performance
The Pages tab in the Performance report shows every URL that earned at least one click or impression during your selected date range. Sorting by clicks reveals your top traffic drivers. Sorting by impressions highlights pages that appear in search results but fail to attract clicks. A low click-through rate on a high-impression page often signals a title tag or meta description that doesn't match search intent. Revisiting those elements can lift traffic without creating new content. For example, a blog post ranking for "how to use google search console" might show 5,000 impressions but only a 2% CTR. The snippet likely needs a stronger call to action or a more specific promise.
To spot underperforming content, filter the Pages report to show URLs with above-average impressions but below-average CTR. These pages are already visible to searchers. They just aren't converting that visibility into visits. Updating the page's heading structure, adding a table of contents, or improving the opening paragraph can align the page more closely with what users expect. The performance report also lets you compare two date ranges. That's useful for measuring the impact of updates. If a page's clicks dropped after a redesign, you can isolate the change and diagnose whether the issue is technical or content-related.
Cannibalization occurs when multiple pages target the same query. It splits authority and confuses search engines. In the Pages tab, click on a URL and then switch to the Queries view. You'll see which keywords drive traffic to that page. If two pages rank for the same high-value term, consolidate them. Merge the weaker page into the stronger one and set a 301 redirect. This process strengthens the remaining page's relevance. It often leads to a noticeable rankings improvement within weeks. A regular audit of the Pages report helps maintain a clean site architecture. It ensures each piece of content serves a distinct purpose.
Index Coverage and URL Inspection
The Index Coverage report is the first place to check when you're learning how to use Google Search Console for diagnosing why pages are missing from search results. It groups URLs into four status buckets: Error, Valid with warnings, Valid, and Excluded. Each row shows the reason, a trend sparkline, and a count of affected pages. Clicking a reason opens a sample list of URLs and a detailed explanation of the issue. This is essential for any google search console guide worth its salt.
Common errors include "Submitted URL has crawl issue," "Server error (5xx)," and "Redirect error." For a crawl issue, start by inspecting the URL. See whether Googlebot was blocked by robots.txt, a noindex tag, or a server timeout. The URL Inspection tool shows the last crawl date, the rendered HTML, and any indexing blockers. If the page is clean but still not indexed, click "Request Indexing" to submit it for a fresh crawl. This is a core step in any gsc seo tutorial. It directly bridges the gap between fixing a problem and seeing it reflected in search.
The Excluded tab is equally valuable. Pages labeled "Crawled - currently not indexed" often signal thin content or duplicate pages that Google chose to skip. "Discovered - currently not indexed" means Google knows about the URL but hasn't crawled it yet. That's usually due to crawl budget limitations on large sites. For these, improving internal linking and pruning low-value pages can help. The Coverage report also surfaces mobile usability issues and structured data errors. It doubles as a quality audit. By monitoring the report weekly and resolving errors promptly, you turn search console insights into a reliable indexing pipeline. Your most important pages stay live in Google.
How to Use Google Search Console for Content Strategy
Search Console Insights is a companion tool that merges Google Search Console data with Google Analytics. It shows you which content resonates with your audience. It surfaces top-performing pages, trending queries, and referral sources. You can spot content gaps without digging through raw reports. For instance, if the Insights dashboard highlights a spike in traffic to a post about local SEO, you might create a follow-up guide on optimizing Google Business Profiles. This feature is available for properties that have an associated Analytics account. It provides a streamlined view of how users discover and engage with your site.
When Insights isn't enabled, you can still build a content strategy. Combine the Performance report with your analytics platform. Look at the Queries table to identify high-impression, low-click keywords. These signal a mismatch between what you offer and what searchers expect. A query like "free keyword research tool" with a 2% CTR on a page about paid tools suggests an opportunity. Create a dedicated free resource. Pair these search console insights with on-page engagement metrics such as bounce rate and time on page. Prioritize updates. Pages with high impressions but low average position may benefit from stronger internal linking or refreshed content. Target the exact phrases users are searching for. This approach turns raw search data into a practical editorial calendar. It helps you systematically close content gaps and improve organic visibility. For more on refining your SEO workflow, check out our SEO guide.
Core Web Vitals and Page Experience
Google Search Console provides a dedicated Core Web Vitals report. It helps you understand how real users experience your pages. The report groups URLs by status (Poor, Needs Improvement, Good) based on three key metrics: Largest Contentful Paint (LCP), which measures loading performance; First Input Delay (FID), which measures interactivity; and Cumulative Layout Shift (CLS), which measures visual stability. You can access this report under the "Experience" section in the left-hand navigation of your Google Search Console property.
The report shows both mobile and desktop data. Google primarily uses mobile performance for ranking evaluations. Each metric has a threshold: LCP should occur within 2.5 seconds, FID should be 100 milliseconds or less, and CLS should be 0.1 or lower. When you click on a specific issue type, such as "LCP issue: longer than 2.5s (mobile)," you see a list of affected URLs. They're grouped by similar page templates. This grouping helps you identify systemic problems rather than treating pages in isolation.
To prioritize fixes, start with the issues affecting the most URLs. Also focus on those with the highest traffic. You can cross-reference with the Performance report. Common fixes include optimizing server response times, compressing images, removing render-blocking JavaScript, and reserving space for embedded content to prevent layout shifts. After deploying changes, use the "Validate Fix" button in the report. This requests Google to re-crawl and reassess the affected pages. This feedback loop is essential for maintaining strong page experience signals. They directly influence your search console insights and overall SEO performance.
Sitemaps and Crawl Stats
Submitting an XML sitemap is one of the most straightforward steps in learning how to use Google Search Console for SEO. A sitemap acts as a roadmap for Googlebot. It lists all the important URLs on your site along with metadata like last modification dates. To submit one, navigate to the Sitemaps section under the Index menu. Enter the relative URL of your sitemap (for example, /sitemap.xml) and click Submit. Google will then periodically fetch and process the file. You can manually trigger a refresh if you've made significant changes.
After submission, the Sitemaps report shows whether Google successfully processed the file. It also shows how many URLs were discovered versus how many were actually indexed. Discrepancies here often point to deeper issues. Noindex tags, canonical conflicts, or crawl budget waste. A well-structured sitemap that only includes canonical, 200-status URLs helps Google focus its resources on your most valuable content.
Alongside sitemaps, the Crawl Stats report (also under Settings) gives you a behind-the-scenes look at Googlebot activity. You can see total crawl requests, download size, and average response time over the last 90 days. Spikes in crawl errors or a sudden drop in requests can signal server problems or configuration changes. They need immediate attention. By cross-referencing crawl stats with your server logs, you can identify patterns. For instance, whether Googlebot is wasting time on low-value parameterized URLs or hitting 404s from broken internal links.
Regularly reviewing both reports ensures that Google can efficiently discover and index your content. If you notice that important new pages aren't being crawled quickly, consider updating your sitemap. Use the URL Inspection tool to request indexing for those specific URLs. A healthy crawl budget means Google spends its time on your best pages. That directly supports stronger organic visibility. For more on technical SEO, see our features page.
Security and Manual Actions
Google Search Console includes a dedicated Security & Manual Actions section. It alerts you when your site has been compromised or when a human reviewer has applied a penalty. The Security Issues tab flags problems such as malware, phishing, deceptive pages, or harmful downloads. When you see a warning here, the issue is often severe enough to trigger a red warning screen in the browser. That can devastate your traffic. Resolving security issues typically involves identifying and removing malicious code, patching vulnerabilities, and then submitting a review request through the same report. Once Google confirms the fix, the warning is lifted. Usually within a few days.
The Manual Actions tab lists penalties applied by Google's webspam team. Violations include unnatural links, thin content, cloaking, or structured data spam. Unlike algorithmic adjustments, manual actions require you to fix the underlying problem and file a reconsideration request. The report describes the violation and often points to affected pages. After cleaning up the issue, you submit a detailed explanation of the steps taken. Reviews can take several days to weeks. Approval isn't guaranteed. Regularly checking these two reports is a critical part of any google search console guide. Undetected security issues or manual actions can silently suppress your rankings for months. For more on Google's policies, visit Google's policies page.
Frequently Asked Questions
How often does Google Search Console data update?
Performance data typically updates every 24 to 48 hours. Some reports like Index Coverage may take a few days to reflect recent changes. The URL Inspection tool shows near real-time status. It's the fastest way to confirm indexing after submitting a page.
Is Google Search Console free to use?
Yes, Google Search Console is completely free. There are no paid tiers or premium features. You can verify an unlimited number of properties under a single Google account. This makes it an essential tool for website owners of all sizes.
Can I share Google Search Console access with my team?
Absolutely. You can add users as Owners, Full users, or Restricted users from the Settings menu. Owners can manage permissions. Full users can view all data and take most actions. Restricted users have read-only access. That's useful for sharing a google search console guide with clients or junior team members without risking accidental changes.
How far back does Google Search Console data go?
Performance data is available for up to 16 months. If you need longer-term trends, you can export data regularly or use the Search Analytics API to store historical records. The Index Coverage report retains data for the lifetime of the property.
Why does my Search Console show fewer clicks than my analytics tool?
Discrepancies often arise because Google Search Console filters out some bot traffic and uses a different attribution model. It also only counts clicks from Google Search results. Analytics tools may include other sources. Both datasets are accurate within their own scopes. Comparing them helps you spot tracking issues or traffic anomalies.